Let’s begin.
Create a Crypto Portfolio Tracker with Google Sheets
Google Sheets has tons of features that you can use to organize your day-to-day tasks, including tracking your stocks. We have seen the best methods to track stock portfolios using Google Sheets. Likewise, you can also track the valuation of all your crypto assets with Sheets.
Step 1: Add List of Cryptocurrencies
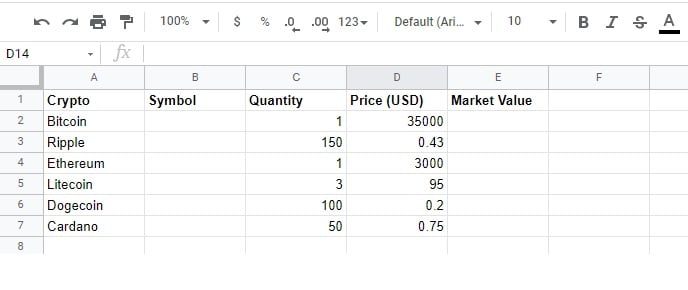
Let’s imagine you had bought a bunch of cryptos (eg. Bitcoin, Ethereum, Dogecoin) and need to monitor their prices so that you can sell them whenever you need. Open a new Google Spreadsheet on your computer and add the following titles for columns.– Crypto: Name of the cryptocurrency– Symbol: Symbol or identifier for the crypto.– Quantity: Number of crypto coins– Price: The price at which you had bought the asset– Market value: Current price of the asset Next, fill in the columns Crypto, Quantity, and Price by referring to your purchase transactions.
Step 2: Get Current Value for Cryptos
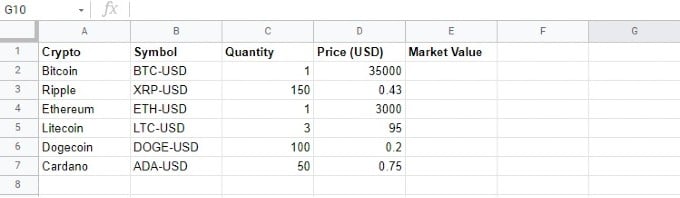
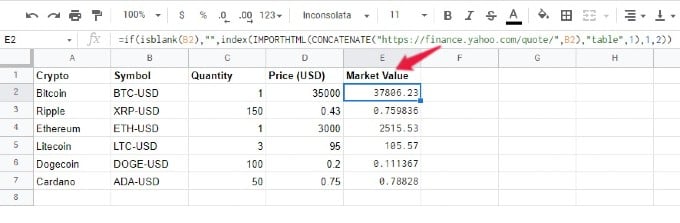
There are multiple websites available on the web like Coinbase, Coinmarketcap, Yahoo Finance, Google Finance to get the current value for cryptocurrencies. In this example, we will be using Yahoo Finance to get the price for cryptos. Go to yahoo.finance.com and click Cryptocurrencies on the Home page. Here, you can see the list of cryptocurrencies in a table with details like Price, Volume, Market cap, and more. Now, we need to retrieve the price for all the cryptos listed on the Google Sheet. To do that, we need to know the Symbol for the crypto. Go ahead and find the symbol for all your cryptos and add the same in the Symbol column in Google Sheet. To get the price of the crypto, we need to concatenate the Yahoo Finance URL and the crypto symbol using the below formula. if(isblank(B2),"",index(IMPORTHTML(CONCATENATE(“https://finance.yahoo.com/quote/",B2),"table",1),1,2)) B2 indicates the column that contains the crypto symbol. If the data in that cell is blank, no action will be taken. Otherwise, it is concatenated with the URL of the website to fetch the value for Crypto. Likewise, this formula is used in all cells of the column titled Market Value to get the current value of the crypto.
Step 3: Create Graphs for Data Analysis
Do you wish to see a visual analysis of your crypto investments? Well, you can easily create a Bar graph, Pie chart, or other types of charts using Google Sheets. If you are new to graphs, check out our detailed guide on how to make pie charts using Google Sheets. In this example, we have plotted the columns Quantity, Price, and Market Value in a Pie Chart as given below: This chart gives an overall picture of the asset distribution and growth. We hope that you can quickly create your own crypto portfolio tracker in Google sheets by following the above steps to monitor your digital assets.
Δ

![]()
![]()
